
INFO
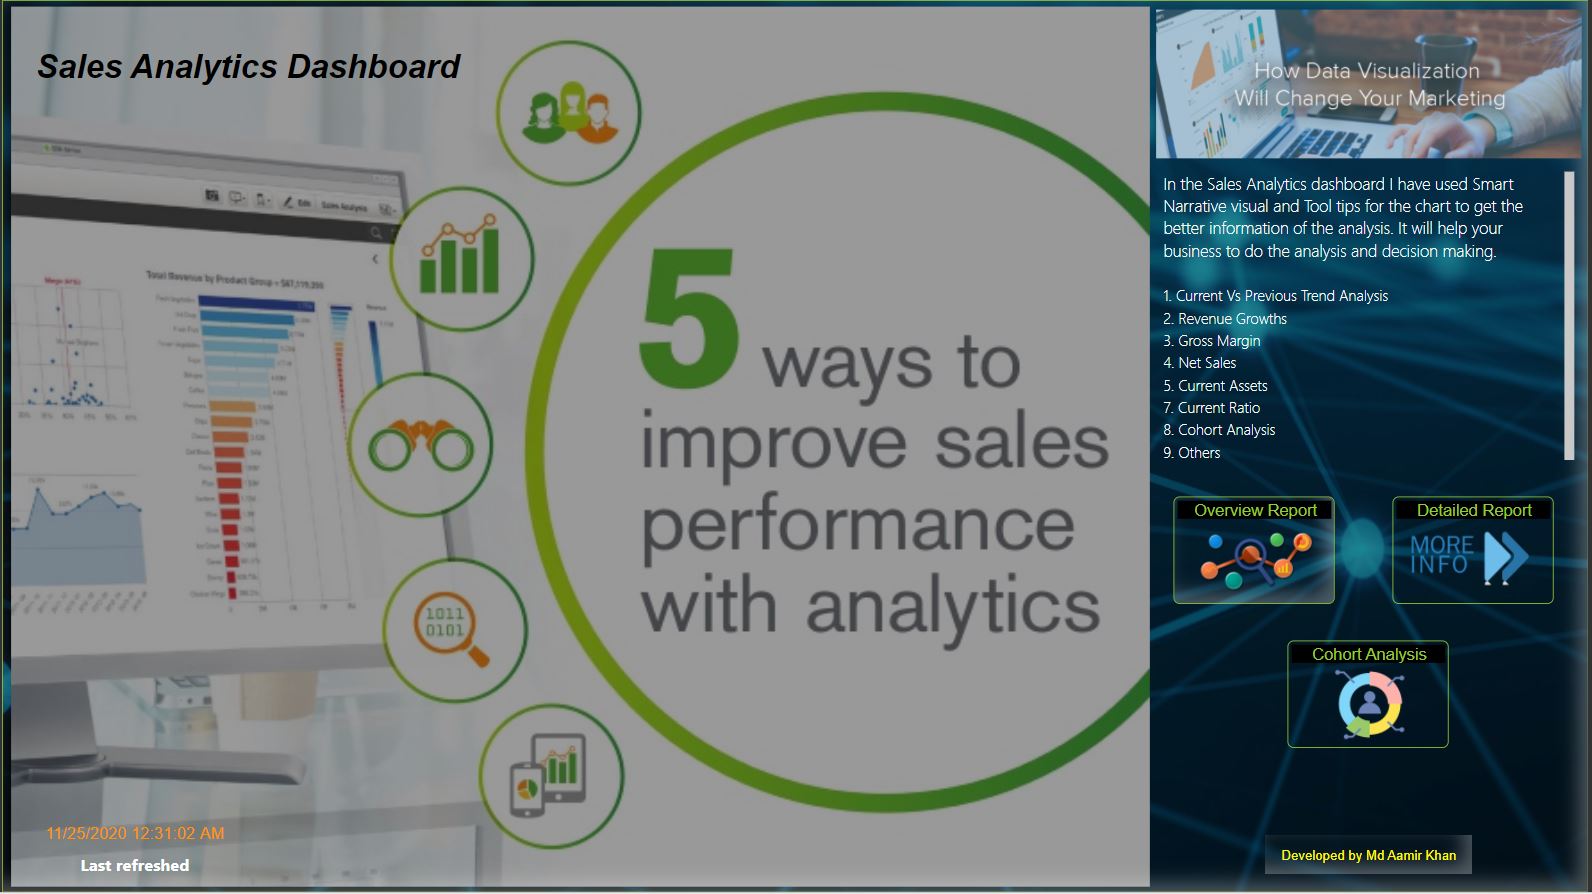
In the Sales Analytics dashboard, I have used Smart Narrative visual and Tool tips for the chart to get the better information of the analysis. It will help your business to do the analysis and decision making.
Data Source: SQL Database & Flat Files

INFO
Transportation Business report combines OPAL tap-on/tap-off data from NSW Trains, Ferries, Buses, Light Rail & Metro. We use these data to compare public transport utilization year over year (2020 vs 2019). The aim is to understand the impact of COVID-19 on passenger levels across all modes of public transport, using 2019 as our baseline.
The common dimensions available in the report include Service, Fare Type and Transport Mode. A definition of these can be found below:
Service: Refers to the service where the tap-on/tap-off occurred e.g. Manly Ferry
Fare Type: Refers to the type of fare for which the tap-on/tap-off occurred e.g. Adult
Transport Mode: Refers to the mode of transport where the tap-on/tap-off occurred e.g. Train
Data Source: Web APIs
INFO
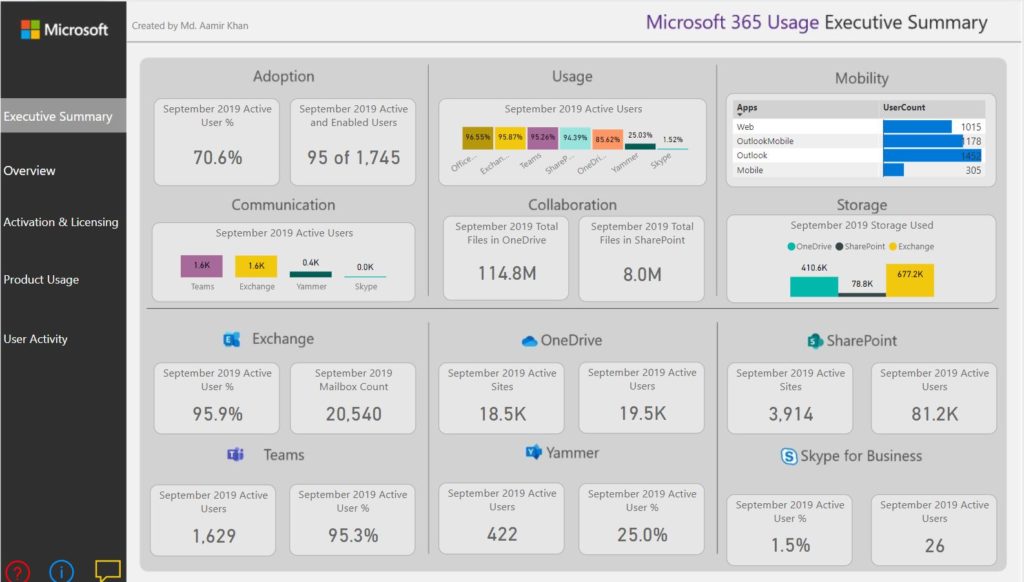
I have done another Analysis on Microsoft’s Project “Microsoft’s 365 Usage Analytics”. And I have prepared the Prototype of the Microsoft 365 Usage Analytics dashboard on Power BI, which can be customized as per the requirement of the company or business for monitoring.
Following dashboard has been submitted to Power BI Community.
Data Source: Web API, Flat Files & SQL Server Database
URL: Microsoft 365 Usage Analytics Report | Data Stories Gallery

INFO
This report is to show the current state of Airbnb’s listings in London, UK & Madrid, Spain.
Data Source: Flat Files
URL: Airbnb Report
![]()
INFO
While preparing proposal in Excel or PPT. I thought that why not prepare a common and standard proposal for everyone in Power BI. Something New & innovative
Next I have prepared digital /dynamic proposal for the clients in Power BI. Where you can select any of the Models with any Top 5 KPI’s or more. Beside that Infrastructure and other details are also provide just you have to select anyone as per your requirements. You will get the costing in $.
Data Source: SQL Server (Database) / Flat File